


The Allure of Record Highs: What’s Driving the Rally?
U.S. stocks are scaling unprecedented heights, with the S&P 500 and Nasdaq both closing at record levels last week. This remarkable rebound comes after both indices suffered significant pullbacks earlier this year—nearly 14% for the S&P 500 and 27% for the Nasdaq. The resurgence is largely fueled by shifting investor focus away from geopolitical tensions and toward monetary policy expectations. As trade war anxieties fade, markets are now betting heavily on Federal Reserve rate cuts and potential tax legislation.
Interest rate swaps currently price in four Fed rate cuts within the next 12 months, creating a powerful tailwind for equities. Simultaneously, investors are closely monitoring the progress of President Trump’s proposed tax cuts, which could further boost corporate earnings if passed by Congress next month. This dual catalyst environment has triggered massive capital inflows, with EPFR Global data showing $164 billion poured into U.S. equities this year alone—putting 2025 on track for the third-largest annual inflow in history.
The psychology behind the surge
Market psychology has shifted decisively toward risk appetite. Three behavioral factors are amplifying the rally:
– Fear of missing out (FOMO) as benchmarks break records
– Chasing performance among institutional investors
– Speculative options trading hitting multi-year highs
This combination creates fertile ground for potential market excesses. When investor euphoria detaches from fundamental valuations, bubble risk naturally increases. Historical precedents like the dot-com era remind us that extended rallies built on monetary easing rather than earnings growth often end abruptly.
Michael Hartnett’s Bubble Risk Warning: A Deep Dive
Bank of America’s chief investment strategist Michael Hartnett (迈克尔·哈特尼特) has emerged as a prominent voice cautioning about mounting vulnerabilities. In his latest research note, Hartnett states: ‘The investor pivot from tariffs to tax cuts and rate cuts could ignite a high-risk market bubble in the second half of 2025.’ His analysis identifies three specific bubble risk indicators flashing warning signs.
First, the S&P 500’s forward P/E ratio now exceeds 22x—35% above its 10-year average. Second, the Buffett Indicator (market cap to GDP) has surpassed 190%, deep into ‘overvalued’ territory. Third, margin debt levels have ballooned to $935 billion, just 7% below the 2021 peak. These metrics suggest valuations are stretching beyond sustainable levels, particularly when corporate earnings growth remains modest outside the tech sector.
Hartnett’s track record of caution
Notably, Hartnett has maintained a cautious stance throughout 2025. He advised investors to ‘sell the rally’ back in April and issued explicit overheating warnings in May and early June. His consistent messaging highlights how current bubble risk concerns aren’t reactionary but stem from disciplined analysis. The strategist observes that when monetary policy becomes the primary market driver rather than fundamentals, corrections become inevitable.
The Fed’s Rate Cut Gamble: Catalyst or Danger?
Market expectations for aggressive Fed easing present a double-edged sword. While rate cuts traditionally boost equity valuations, the scale of anticipated easing—potentially 100 basis points within a year—could signal underlying economic fragility. The Fed faces a delicate balancing act: cutting too slowly might accelerate an economic slowdown, while cutting too aggressively could inflate asset bubbles beyond control.
Current Fed funds futures indicate:
– 78% probability of first cut by September
– 42% chance of four cuts by June 2026
– 15% possibility of five or more cuts
This dovish outlook is weakening the U.S. dollar, which has declined 4.2% against major currencies this quarter. A weaker dollar typically benefits multinational corporations but also imports inflation, potentially limiting the Fed’s maneuvering room. When central bank policy becomes this pivotal to market performance, it significantly amplifies bubble risk as investors increasingly ignore traditional valuation metrics.
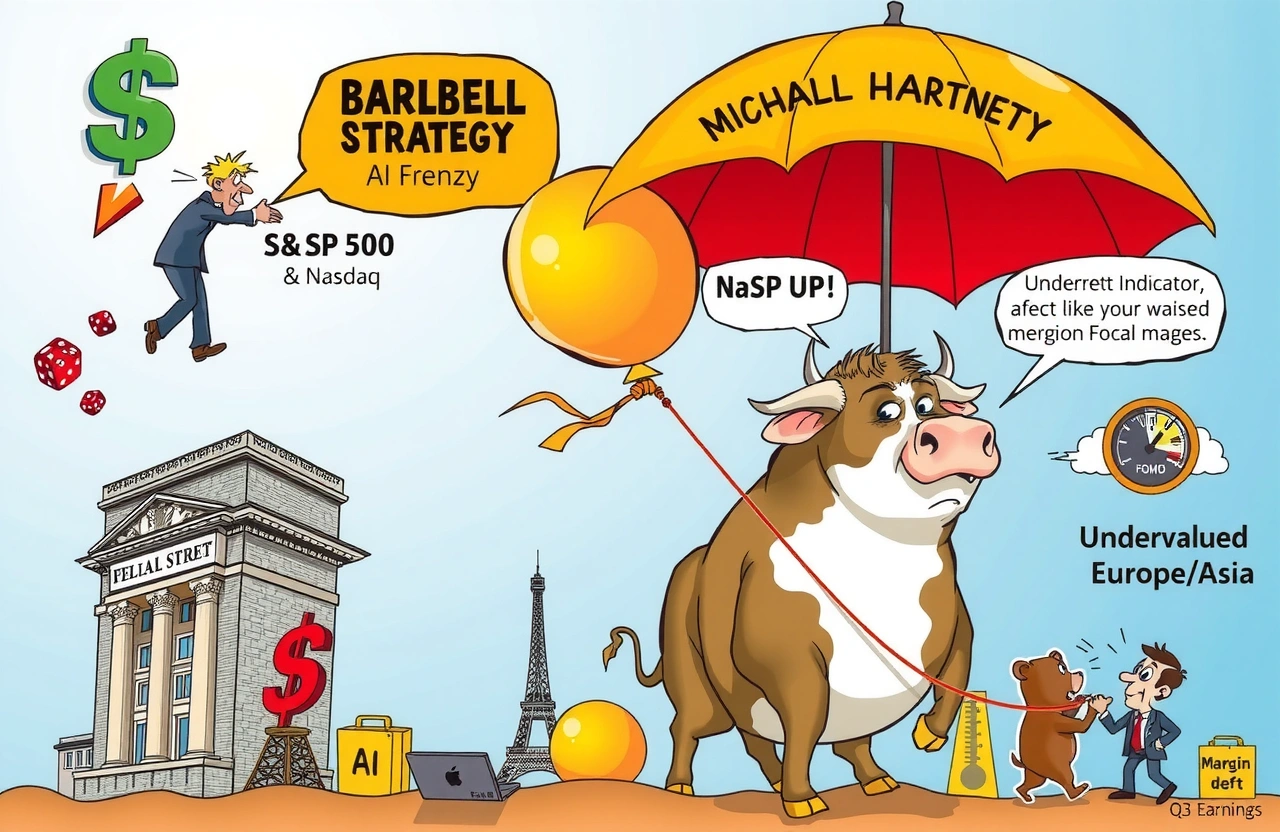
Navigating the Bubble: The Barbell Strategy Explained
Amid rising bubble risk concerns, Hartnett recommends a ‘barbell strategy’ for portfolio construction. This approach balances exposure to growth and value stocks across geographic regions to mitigate potential downside while maintaining upside potential. The strategy involves two complementary allocations:
– U.S. growth stocks: Primarily in technology and innovation-driven sectors
– Global value stocks: Focused on international markets with lower valuations
This dual approach aims to capture growth from American market leaders while hedging through undervalued international opportunities. For instance, investors might pair positions in AI-focused U.S. tech firms with shares in European banks or Japanese industrial conglomerates trading below book value. The barbell method provides crucial diversification—when growth stocks falter during corrections, value stocks often demonstrate greater resilience.
Implementing the barbell approach
Practical implementation involves three steps:
1. Allocate 50-60% to U.S. growth: Focus on companies with sustainable competitive advantages and strong balance sheets
2. Allocate 30-40% to international value: Target markets with favorable demographics and discounted valuations
3. Maintain 10% cash reserves: Preserve dry powder for buying opportunities during volatility
This structure allows investors to participate in ongoing momentum while building defenses against potential bubble risk. Historical analysis shows barbell strategies outperformed pure growth portfolios by 3-5% annually during the 2000 and 2008 market downturns.
Corporate Earnings: The Bubble Antidote?
Hartnett identifies accelerating corporate profits as the most plausible counterweight to bubble risk. Excluding artificial intelligence euphoria, genuine earnings growth could provide fundamental support for elevated valuations. Current projections suggest S&P 500 earnings may grow 12% year-over-year in Q3—the highest rate since 2021. This earnings momentum could validate current prices if sustained.
The tax cut legislation pending in Congress represents a potential earnings catalyst. Analysis from Goldman Sachs indicates that if passed, corporate tax reductions could boost S&P 500 EPS by 7-9%. However, investors should monitor these key earnings indicators:
– Forward guidance revisions in Q2 earnings calls
– Net profit margin trends across sectors
– Revenue growth outside technology
Without meaningful earnings expansion beyond the AI sector, the market’s elevated valuations become increasingly difficult to justify. This earnings dependency creates significant bubble risk should corporate performance disappoint in coming quarters.
Contrarian Views: The Bull Case for Continued Gains
Despite Hartnett’s bubble risk warnings, other institutions remain bullish. UBS recently raised its year-end S&P 500 target from 6,000 to 6,200 and its mid-2026 projection from 6,400 to 6,500. This optimistic view hinges on three arguments:
First, the AI investment cycle remains in its early innings, with enterprise adoption still below 30% across most industries. Second, consumer balance sheets remain healthy with household debt servicing costs near 30-year lows. Third, any Fed easing would likely extend the economic expansion rather than merely cushioning a downturn.
Historical data also offers perspective: since 1950, the S&P 500 has gained an average of 17% in the 12 months following the first rate cut of a cycle. This suggests that even if bubble risk exists, markets could continue climbing before any significant correction. Investors should note that during the 1990s tech boom, warnings about excessive valuations emerged years before the eventual peak.
Monitoring the bubble risk indicators
Prudent investors should track these key metrics to gauge bubble risk levels:
– IPO activity: Surges in new listings often signal market tops
– Retail participation: Margin debt and options volume indicate speculation
– Leadership concentration: When fewer stocks drive index gains
– Credit spreads: Widening corporate bond yields foreshadow trouble
Currently, only the leadership concentration indicator flashes red, with the top 10 S&P 500 stocks comprising 35% of the index. Other metrics remain within historical norms, suggesting that while bubble risk is elevated, conditions haven’t reached extreme levels seen during previous market manias.
Strategic Positioning for Uncertain Times
Navigating today’s markets requires balancing opportunity recognition with bubble risk awareness. Investors should consider these actionable steps:
First, rebalance portfolios to ensure alignment with risk tolerance—trimming winners that have become oversized positions. Second, increase international diversification beyond U.S. markets, particularly in regions with lower valuations. Third, maintain disciplined entry points rather than chasing momentum, using dollar-cost averaging for new investments.
The coming months will test whether current valuations reflect a new paradigm or speculative excess. While the bubble risk highlighted by Michael Hartnett (迈克尔·哈特尼特) demands caution, it shouldn’t prompt wholesale retreat. History shows that markets can remain elevated for extended periods before fundamentals reassert themselves. By implementing the barbell strategy, monitoring key indicators, and maintaining portfolio flexibility, investors can position themselves to weather potential volatility while capturing ongoing opportunities. Remember that successful investing isn’t about predicting tops and bottoms—it’s about constructing resilient portfolios that can thrive across market cycles. Review your asset allocation today to ensure it reflects both the opportunities and risks in this record-setting market environment.